


Six Marketing KPIs You Should Be Tracking

You’re likely already tracking the obvious KPIs like Sales Qualified Leads (SQLs) and Cost per Acquisition, but there’s several other valuable ones that you might have overlooked.
The right marketing KPIs will help you identify what’s working, what isn’t and gives you an indication of whether a tactic is moving in the right direction. This is significant because you don’t want to continue supporting an activity that is losing you money.
In particular, the six marketing KPIs we’ll be covering in this article are:
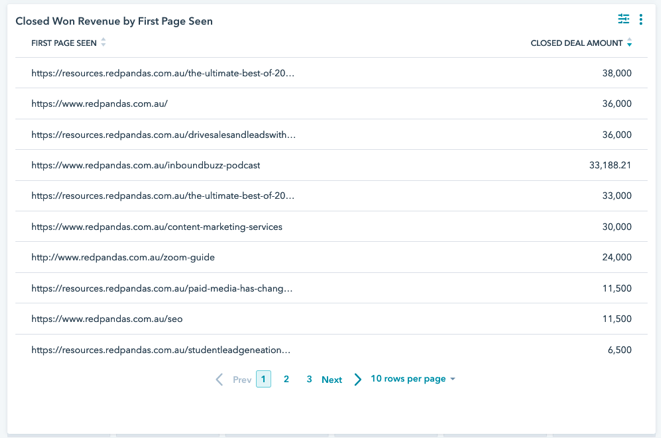
Content Marketing Revenue Attribution
This metric answers one question; how much of your revenue can be attributed to your content marketing efforts?
Interestingly enough, the businesses that do track this tend to be the same businesses that consistently produce content and use content in their sales activities.
With this metric, you’re looking beyond the number of qualified leads you close to see how much of your revenue is influenced by your marketing efforts. Tracking this information is a great way for your team to show the monetary value of their efforts. If you’re using HubSpot, they make it easy for you to track and report on these numbers.
Customer Acquisition Cost
The Customer Acquisition Cost (CAC) answers one question; how much does it cost to acquire one new customer? In particular, this metric looks at the total sales and marketing spend needed to gain a new customer, which includes all marketing costs, salaries, commissions, technology, software, and any overhead associated with a lead becoming a customer. The CAC should be calculated for both inbound marketing and outbound marketing.
To calculate the CAC, you add your total marketing expenses and sales expenses and divide that by the number of new customers acquired.
Total Marketing Expenses & Sales Expenses / Number of new customers acquired
The CAC is an important metric to calculate because it can:
- Help you forecast future revenue: you will be able to calculate the amount of revenue you will generate
- Help you price your products / services in a way which generates profit
Customer Lifetime Value
The Customer Lifetime Value (LTV) is the average overall value of a customer and is calculated by multiplying our average sales by the number of times a customer buys per year multiplied by the average lifetime of a customer (years or months).
Average Sales x Number of times a customer purchases in a year x average length of time a customer remains a customer.
This one is especially important because it always cost more money to acquire new customers, so if you can generate more revenue from existing customers, this drops your total cost of gaining new customers, ultimately leading to more profit.
Traffic to Lead Ratio
One of the more commonly tracked KPIs, the Traffic to Lead ratio is also known as the new contact rate and it tells us the percentage of website visitors who become a lead. It is calculated by dividing traffic by leads.
Total Traffic / Total Leads
This metric is a key contributor to success or failure in the digital space. Generating a large volume of traffic doesn’t necessarily lead to conversions, and it’s this metric which can tell us whether what we need is more traffic or a better optimised website.
For example, your traffic may be increasing, but your traffic to lead ratio might be decreasing. This would be an indicator that something is missing on your landing page, resulting in fewer conversions despite the traffic increase.
In other words, this scenario is one in which you’re bringing more horses to the water but they aren’t drinking. This could be caused by a number of reasons, such as misalignment between what users thought they were clicking on and the information you gave them.
Whatever the case is, the traffic to lead ratio can help you optimise your website for a greater number of conversions. If you want to take things to the next level, you could look at recording user activity on your website via a tool like Hotjar.
Lead to Customer Ratio
Another commonly measured KPI is the Lead to Customer Ratio. This metric tells us how many of our leads turn into closed sales. It is calculated by dividing the number of leads that resulted in sales by the number of leads.
Number of leads that resulted in sales / Number of leads
A lower lead to customer ratio might indicate that your sales funnel needs to be optimised in order to actually convert these leads into customers.
In terms of what you may do to optimise the Lead-to-Customer ratio, the list is endless but what we often recommend first is map out and audit your customer journey map.
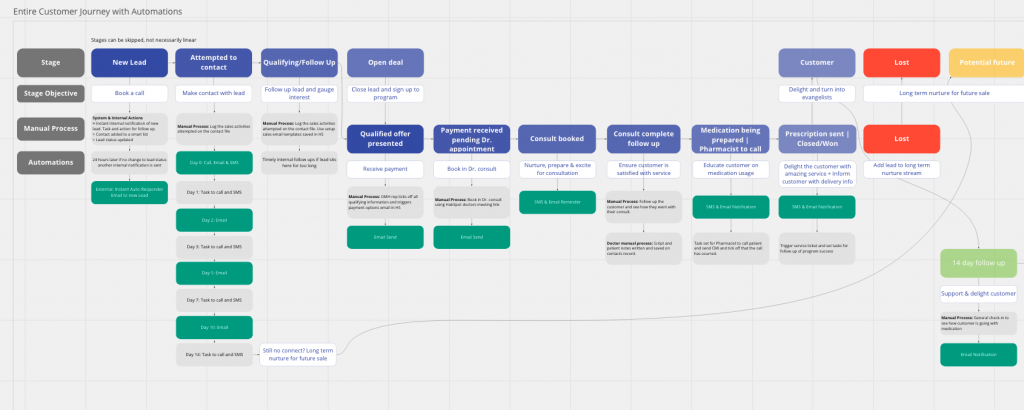
The customer journey map is exactly what it sounds like, a visual map of the journey a customer takes from not knowing you at all to hopefully becoming a delighted customer. Common questions we ask when we audit customer journeys include:
- How fast does sales respond to leads?
- How often do sales follow up prospects? Is this documented?
- Is there a CRM that automates follow-ups or reminds sales reps when to follow-up?
- Do you know when leads visit high-intent pages like a pricing page?
From here, there are a variety of tactical optimisation you could make e.g. A/B testing text messages or emails in your funnel, adding 1-to-1 video in the mix, adding follow-ups based on digital behaviour triggers such as a prospect opening an email after going cold.
Once you switch something up, you’ll want to check if the lead to customer ratio changes. If it increases, then you know you’re on the right track and you should continue optimising in the same way. If it decreases or stays the same, then you might want to test a different part of your sales funnel.
Organic Traffic & Your Top Five Entry Pages
This tells us the number of visitors coming to our website from organic search and the top five pages generated organic traffic.
Why five? It could easily be 10. In our experience though, businesses underestimate the time it may take to optimise just one organic landing page let alone 10. Optimising five pages first and then measuring the impact is a great place to start.
The goal of any inbound marketing strategy is to have the majority of your website traffic come from organic search. The benefit of clicks from organic search is that you don’t have to pay for them and there is more trust attributed to them because they don’t appear as an ad.
The top five pages bringing visitors to your website (likely landing pages or blog articles) are the first experience that visitors are going to have of your company and website. Not only should you track those pages, but you should make sure those pages are updated and optimised for conversions.
Some key questions you might want to consider when optimising your page:
- Do you have call-to-action buttons on the page?
- Could you build a chat-bot that is unique to the page?
- Have you added a pop-up to your website?
There are more questions that you could also consider, but these are a good start. If you want to improve your website, here are five things that you should absolutely include on your website.
To Sum Up
The six key marketing KPIs you should be tracking are:
- Content Marketing Revenue Attribution
- Customer Acquisition Cost
- Customer Lifetime Value
- Traffic to Lead Ratio
- Lead to Customer Ratio
- Organic Traffic & your top 5 entry pages
If you’re looking for more resources to help grow traffic, leads and sales then subscribe to our newsletter or get in touch with us here.

Get the best content marketing insights right in your inbox!
Subscribe to our Newsletter and get marketing insights delivered to your inbox every week.