









How to Set Up Gross Profit Margin Reporting in HubSpot (Plus Director & CEO Dashboards)

HubSpot reporting dashboards are genuinely powerful, but gross profit margin reporting still sits in a blind spot that trips up even experienced operators.
The problem is that the CRM has no standard fields for “Total contract cost,” “Annual contract margin,” or “Total contract margin” at the deal level. It can report on revenue, but not the cost underneath it or the margin in between.
The community forums reflect the frustration: thread after thread asks how to visualise margin percentage at the deal level.
Dozens of questions end up with users realising that calculated properties aren’t available for line items and that using product properties in deal-level calculations isn’t supported natively.
But there’s a path through it.
Setting up gross profit margin reporting on HubSpot requires the right sequence of custom properties, a calculated property formula, and a clear understanding of where to surface the data.
And once it’s in place, you can build a Director Dashboard and a CEO Daily Dashboard that actually tell leadership what they need to know each morning.
At RedPandas Digital, we’ve implemented this exact reporting stack for B2B services businesses across ANZ, and this article walks you through every step.
Quick Answer
To set up gross profit margin reporting in HubSpot, you need two custom deal properties:
- A rollup property that sums the margin across all associated line items
- A calculated property that divides that total by the deal amount to give you GPM%
Once those properties exist at the deal level, you can pull them into custom reports and surface them on any HubSpot reporting dashboard: by rep, by pipeline, and by month.
You’ll need Sales Hub Professional or Enterprise for calculated properties.
Why HubSpot Gross Profit Reporting Per Deal Is So Hard
Margin lives at the line item level, which means that you can’t calculate it there.
Every line item has a Unit Cost field and a Total Contract Value Margin field.
The data exists… But calculated properties aren’t available on line items, and deal-level calculations can’t pull line item properties directly.
The deal record tracks Total Contract Value, but it has no standard field for Total Contract Margin, so revenue shows up by default while margin doesn’t.
That gap is why most HubSpot reporting dashboards skip gross profit entirely.
The fix here is two properties at the deal level: one pulls up the margin, and the other turns it into a percentage.
What You Need Before Building HubSpot Reporting Dashboards for GPM
- Sales Hub Professional or Enterprise: Calculated properties are only available on Professional or Enterprise subscriptions. Sales Hub Professional currently runs to around A$155 per seat, per month (excl. GST) in Australia; Enterprise sits above that. See our full HubSpot Sales Hub pricing breakdown if you’re not sure which tier you’re on
- Line items in active use, with Unit Price and Unit Cost both populated: A blank Unit Cost field returns a zero margin, which can make the dashboard meaningless
- Costs loaded into the product library or entered manually on custom line items if your team builds them deal-by-deal
How to Set Up Gross Profit Margin Reporting at the Deal Level
If you’re looking for in-depth visibility into your gross profit margins, there are three steps you need to follow to build solid, reliable reporting when you analyse at the deal level:
Step #1: Create a Rollup Property to Pull Margin to the Deal
Rollup properties calculate the sum of a property’s values across associated records. This step uses that to total the margin from every line item on a deal.
Here’s how to do it:
1. Go to Settings → Data Management → Properties
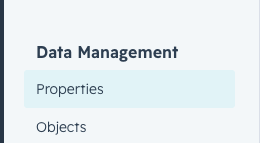
2. Select Deal properties from the object dropdown
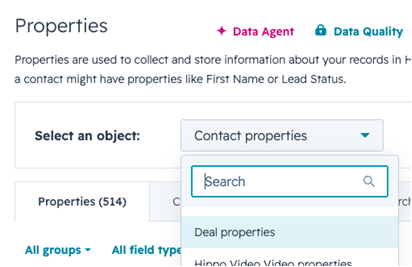
3. Click Create property
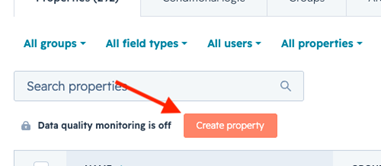
4. Label it: “Total Contract Margin”
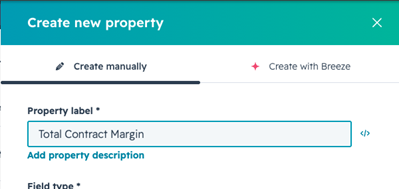
5. Set Field type to Rollup
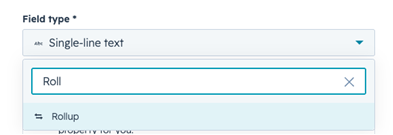
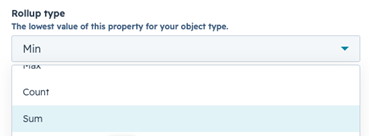
6. Set Rollup type to Sum
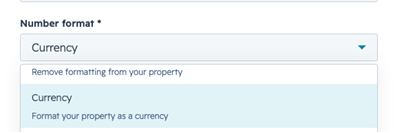
7. Set the Number format to Currency
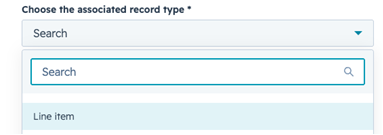
8. Set the Associated record type to Line item
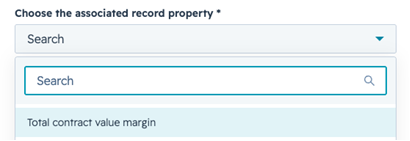
9. Set the Associated record property to Total contract value margin
10. Click Create Property at the bottom
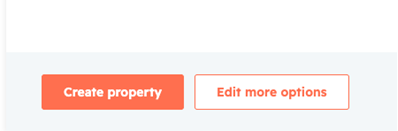
This now totals the margin from every associated line item on the deal record itself.
Step #2: Create a Calculated Property for GPM%
With margin sitting at the deal level, you can turn it into a percentage by following these substeps:
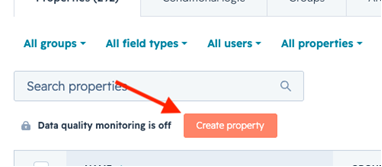
1. In Deal properties, click Create property
2. Label it: “Gross Profit Margin %”
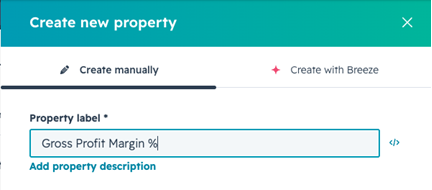
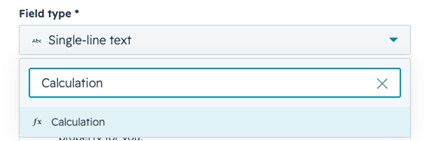
3. Set Field type to Calculation
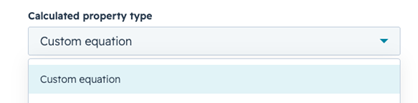
4. Set the calculated property type to Custom equation
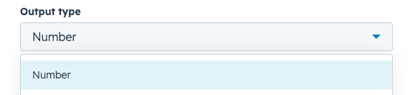
5. Set output type to Number
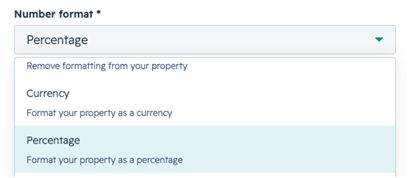
6. Set Number format to Percentage
7. Build the formula using Insert → Properties to add each field. Don’t type internal names manually; selecting from the picker avoids typos
[properties.total_contract_margin] / [properties.amount] * 100
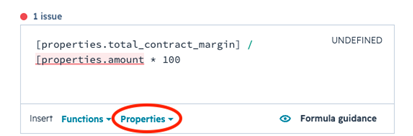
Substitute your actual property internal names if you labelled the rollup property differently.
8. Click Test formula to confirm it returns a sample output before saving
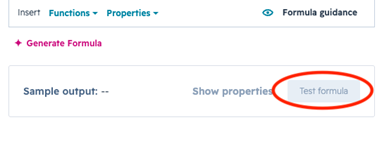
9. Save, then Create Property
Note: A deal with no line items yet returns a null margin, and dividing by a non-zero amount will show zero per cent rather than an error. Don’t read zero per cent as “this deal has no margin”: check whether line items have been added before trusting the figure.
With margin sitting at the deal level, you can use it in reports, workflows, and dashboards, including commission calculations or pipeline views filtered by profitability.
Step #3: Surface Both Properties on the Deal Record
1. Go to Settings → Objects → Deals → Record customisation
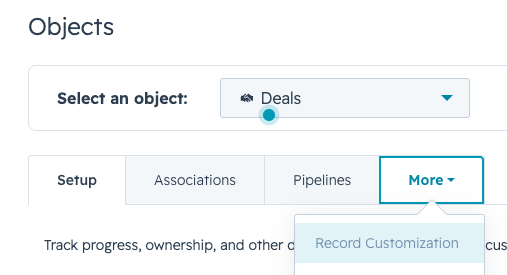
2. Add Total Contract Margin and Gross Profit Margin % to the About this deal section
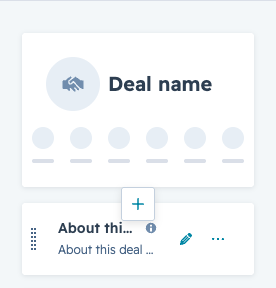
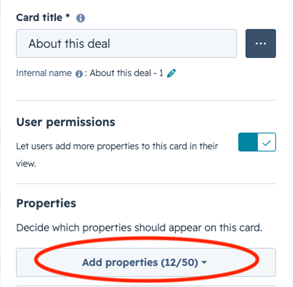
3. Drag them near the top, so they’re visible without scrolling
Both properties are now available for any custom report and ready to drop straight into your HubSpot reporting dashboards.
Building a Director Dashboard With HubSpot Reporting Dashboards
A revenue director and a sales rep need entirely different views of the same data.
The director’s job is to spot patterns, manage pipeline health, and intervene before the quarter is at risk, not to track individual daily activity.
Coverage ratios below 3:1 typically indicate insufficient prospecting activity and increased risk of missing revenue targets. On the other hand, ratios above 8:1 often suggest poor qualification standards or unrealistic opportunity valuations.
A director needs that ratio and a handful of others like it on a single screen instead of having them buried inside ten separate reports.
This is where most HubSpot reporting dashboards go wrong.
They’re built once, for everyone, and end up serving no one well.
The build below follows one rule instead: every report must answer a question that leads to a decision.
If a chart can’t trigger an action, it doesn’t belong on this dashboard.
How to Create This HubSpot Reporting Dashboard
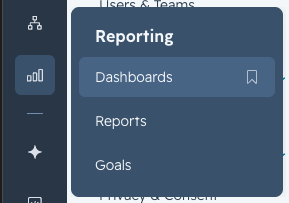
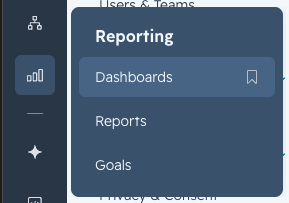
1. Navigate to Reporting → Dashboards
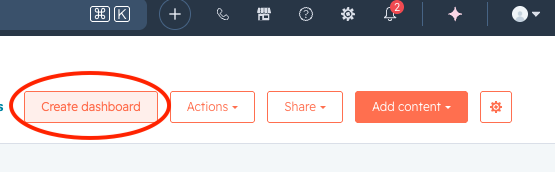
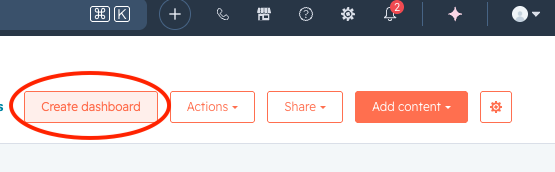
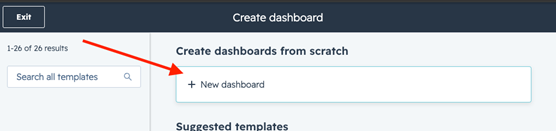
2. Click Create dashboard → Blank dashboard
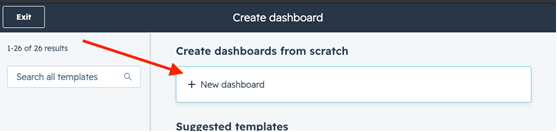
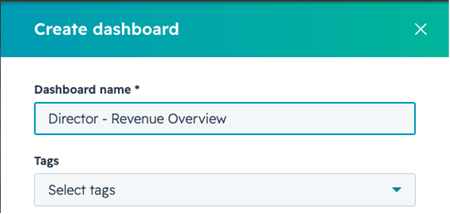
3. Name it: “Director – Revenue Overview”
4. Set visibility to the relevant user or team: this dashboard is built for one audience, not the whole company
Add the following reports one at a time using Add report, either from the existing report library or via the Custom Report Builder:
The 6 Reports That Belong on a Director-Level HubSpot Reporting Dashboard
Director Dashboard Layout
| Row | Left | Right |
| 1 | Closed Won vs. Goal (KPI tile) | Pipeline Coverage Ratio (KPI tile) |
| 2 | Open Pipeline Value by Stage (full width) | |
| 3 | Gross Profit Margin % by Deal: table | Win Rate by Rep: bar chart |
| 4 | Deals With No Activity (14+ days) (full width) |
Set a recurring email snapshot so this HubSpot reporting dashboard lands in the director’s inbox automatically: go to Dashboard → Actions → Schedule email and set it to send every Monday morning before the weekly pipeline review.
And if you want to learn more about how you can use HubSpot reporting to improve your sales strategies and decision-making, here’s a podcast episode that covers it:


7 HubSpot Sales Reports Every Team Should Be Running
Building a CEO Daily HubSpot Reporting Dashboard
The CEO Daily Dashboard has one job: to answer the three questions below without the CEO opening a report, running a query, or messaging the sales team.
- “Are we on track to hit this month’s revenue target?”
- “Is there enough pipeline to hit next month’s?”
- “Is anything broken that needs attention today?”
Every tile below maps directly to one of those three.
The goal is simplicity and clarity: a dashboard that answers big-picture questions in 60 seconds or less.
Each report on a CEO-level HubSpot reporting dashboard should pass one test: if this number changes, what specific action follows?
No clear answer means the report doesn’t belong here.
The CEO Daily dashboard is deliberately narrower than the Director Dashboard.
While the Director needs six reports covering pipeline depth, rep performance, and deal velocity, the CEO needs five: all outcomes with no operational detail needed.
How to Create the CEO Daily Dashboard
1. Navigate to Reporting → Dashboards
2. Click Create dashboard → Blank dashboard
3. Name it: “CEO – Daily Revenue Snapshot”
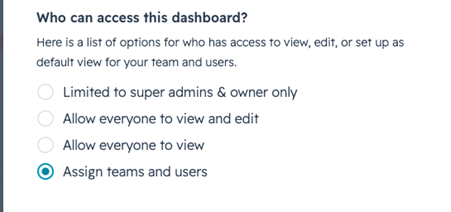
4. Set visibility to the CEO (private, or view-only access for any admin managing it)
HubSpot Reporting Dashboards: The 5 CEO Daily Reports Needed
| # | Report | Answers | Report type | Filter/setup |
| 1 | Closed Won Revenue vs. Monthly Goal (MTD) | Are we on track? | Single value (KPI tile) | Close date = this month to date; deal stage = Closed Won; goal set against monthly revenue target |
| 2 | Total Open Pipeline Value | Is there enough behind it? | Single value (KPI tile) | All open deals (exclude Closed Won and Closed Lost); display total deal amount |
| 3 | Gross Profit Margin % – Closed Won (This Month) | Is this revenue actually healthy? | Single value (KPI tile) | Close date = this month; deal stage = Closed Won; display average GPM% using the Gross Profit Margin % calculated property |
| 4 | New Deals Created (This Month) | Is anything breaking upstream? | Single value or small bar chart | Create date = this month; display deal count and total value |
| 5 | Deals Closed Lost (This Month) | Is anything breaking downstream? | Single value (KPI tile) | Close date = this month; deal stage = Closed Lost; display count and total lost value |
Dashboard Layout
Keep all five reports on one screen, no scrolling:
| Row | Tile 1 | Tile 2 | Tile 3 |
| 1 | Closed Won vs. Goal | Open Pipeline Value | GPM% (Closed Won) |
| 2 | New Deals Created | Deals Closed Lost | (empty) |
The most effective dashboards contain five to ten metrics maximum: more can dilute focus and slow decision-making.
Five is right for a daily CEO view; anything deeper belongs on the Director Dashboard, not here.
Frequently Asked Questions About HubSpot Reporting Dashboards
How do I set up gross profit margin reporting in HubSpot?
To set up gross profit margin reporting in HubSpot, create two custom deal properties: a rollup property that sums the “Total contract value margin” across all associated line items, and a calculated property that divides that figure by the deal amount to produce a GPM percentage. Both properties require Sales Hub Professional or Enterprise.
What HubSpot reporting dashboards does a revenue director actually need?
A revenue director’s HubSpot reporting dashboard should include six focused reports: Closed Won Revenue vs. Goal (This Month), Pipeline Coverage Ratio, Open Pipeline Value by Stage, Gross Profit Margin % by Deal (This Month),Win Rate by Rep (Rolling 90 Days), and Deals With No Activity in 14+ Days.
What is the difference between a Director Dashboard and a CEO Dashboard in HubSpot?
A Director Dashboard in HubSpot contains six reports covering pipeline depth, rep performance, deal velocity, and profitability, designed for weekly operational review. A CEO Dashboard contains 5 high-level KPI tiles covering closed-won revenue vs. goal, open pipeline value, average GPM%, new deals created, and closed-lost deals: designed for a 60-second daily read with no operational detail.
What HubSpot tier do I need for gross profit reporting and sales forecasting?
Calculated properties (required for GPM% at the deal level) are only available on Sales Hub Professional or Enterprise subscriptions. The sales forecasting tool, including forecast categories, rep submissions, and goal tracking, also requires a Professional or Enterprise plan. Rollup properties (used to sum line item margin to the deal level) are available on the same tiers.
How many reports should be on a HubSpot reporting dashboard?
Having 8 to 12 reports per dashboard is ideal for focus: enough to tell a complete story without overwhelming the viewer. For role-specific dashboards like a CEO Daily view, having 5 tiles is the right ceiling. Every report on a dashboard should answer a specific question that leads to a decision; if it can’t, it belongs in a saved reports list rather than a live dashboard.
Can I send HubSpot reporting dashboards automatically by email?
Yes: HubSpot dashboards can be scheduled to send as recurring email digests daily, weekly, or monthly, or shared directly to Slack from within HubSpot. To set this up, open the dashboard, click Share → Email this dashboard, choose your frequency and recipients, and save the schedule. Note that the email sends a link to the live dashboard rather than an embedded visual, so recipients need a HubSpot login to access the full view.
Get Your HubSpot Reporting Dashboards Set Up Right
Building HubSpot reporting dashboards that cover gross profit margin, director-level pipeline visibility, and reliable sales forecasting is achievable for any Australian B2B business on Sales Hub Professional or Enterprise.
What trips most teams up is doing the steps in the right order and making sure the data going into the system is clean enough to trust. This is a problem that traces back to why HubSpot implementations fail in the first place.
At RedPandas Digital, we implement this exact reporting stack for Australian B2B businesses across professional services, SaaS, and training and services sectors.
As a HubSpot Diamond Partner and one of only four agencies in APAC with HubSpot’s Partner Accreditation, our team has built hundreds of HubSpot portals across ANZ.
And the gap between a pipeline that leadership trusts and one they ignore almost always comes down to how reporting was configured at the foundation.
If your CRM has the data but your dashboards aren’t surfacing it in a way that drives decisions, get in touch with our growth experts for a free consultation on how to fast-track your way to long-term sales visibility and clarity.
Get in Touch With Our Growth Experts
About This Article
This article was written by the team at RedPandas Digital, a HubSpot Diamond Solutions Partner based in Sydney, Australia. RedPandas has implemented HubSpot for 150+ Australian businesses across B2B services, SaaS, higher education, and professional services. View our HubSpot partner profile or learn more about the RedPandas team.



Get the best content marketing insights right in your inbox!
Subscribe to our Newsletter and get marketing insights delivered to your inbox every week.