









HubSpot Conversion Reports: What They Are, Where to Find Them, and How to Use Them

Quick question: when your CEO asks “What’s actually converting?”, do you:
- Know exactly which HubSpot conversion report to pull
- Spend ten minutes clicking around hoping something useful surfaces
If it’s the latter, you’re not alone.
82 per cent of marketers don’t trust their own attribution data… And a big part of that comes down to not knowing where to look, or pulling numbers from the wrong place entirely.
Generally, HubSpot reporting has a lot of power sitting inside it. The problem is that conversion data doesn’t live in one tidy spot.
It’s spread across:
- Dashboards
- Contact timelines
- Campaign analytics
- The report builder
And without a clear map, it’s easy to end up with numbers that contradict each other depending on who’s reporting and what filters they’re using.
In this article, you’ll walk away knowing exactly what counts as a conversion in your CRM, where that data lives, how to build reports that actually reflect what’s happening in your pipeline, and how to turn those numbers into decisions.
Whether you’re a marketer trying to prove campaign ROI, a sales leader tracking deal stage conversion rates, or a RevOps manager trying to get the full funnel into one view, this one’s for you.
What Counts as a Conversion in HubSpot Reporting?
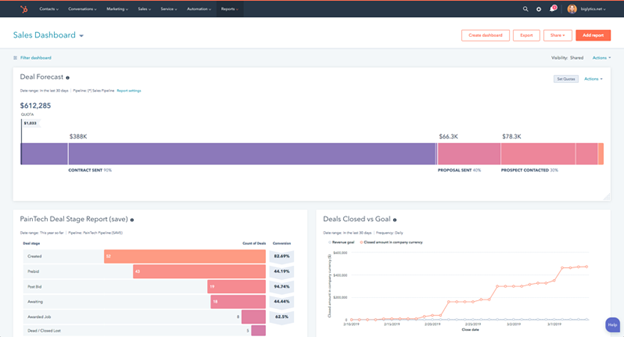
Most teams think they’re measuring the same thing. They’re not.
In HubSpot reporting, “conversion” means something different depending on who’s asking.
Marketing might count 200 conversions in a quarter. Sales might count 14. Both numbers are correct, but they’re just tracking completely different events.
There are four conversion types your CRM tracks:
| Conversion Type | Details |
| Form submission | A visitor submits a form. This is the default conversion in HubSpot reporting. The “First conversion” property records the first form submitted; “Recent conversion” updates with every new submission |
| Lifecycle stage change | A contact progresses through your funnel: Lead → MQL → SQL → Opportunity → Customer. Each move is a conversion. Contacts from form submissions are automatically set to your account’s first lifecycle stage, unless you’ve configured a default in the form settings. Misconfigured forms corrupt this data immediately. |
| Meeting booked | A prospect books via your scheduling link. Most B2B teams treat this as their SQL conversion event. A workflow triggered by a meeting booking can automatically update the lifecycle stage to SQL and create an associated deal. |
| Deal created or progressed | A deal enters or moves through the pipeline. This is what sales usually cares about most, but it’s rarely what marketing tracks. |
When each team measures different events, your HubSpot reporting produces different numbers from the same data.
Fix it before you build a single report by agreeing on what “conversion” means at every funnel stage. Here’s what that usually looks like:
| Funnel Stage | Conversion Event | Owner |
| Top of funnel | Form submission | Marketing |
| Mid funnel | Lifecycle stage change to MQL | Marketing |
| Sales handoff | Meeting booked / SQL | Sales |
| Pipeline | Deal created | Sales |
| Revenue | Closed Won | RevOps |
Align on this table first, because everything else in your HubSpot reporting builds on it.
Where Conversion Data Lives in Your HubSpot Reporting
Your CRM stores conversion data in five different places. Each one answers a different question:
1. The Report Library
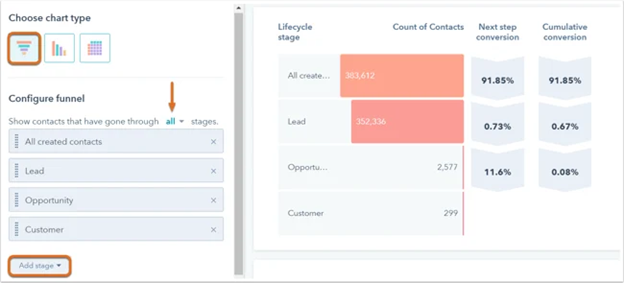
Go to Reporting → Reports → Report Library and search “funnel.”
Pre-built lifecycle and deal stage funnel reports appear immediately, no configuration needed.
All HubSpot accounts include standard reports to help you get started measuring the success of your business.
2. The Analytics Suite
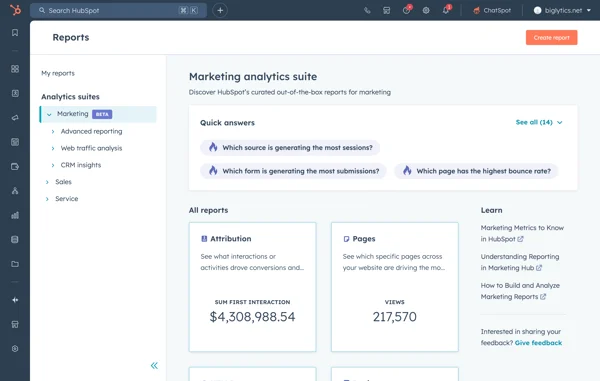
Go to Reporting → Reports → Analytics Suite.
Depending on your subscription, you’ll have access to the sales, service, marketing, and commerce analytics suites.
The Marketing tab covers form submissions and channel performance, while the Sales tab covers deal stage progression and pipeline conversion rates.
Note: the limit here is that neither tab gives you a unified marketing-plus-sales conversion view.
3. Campaign Analytics
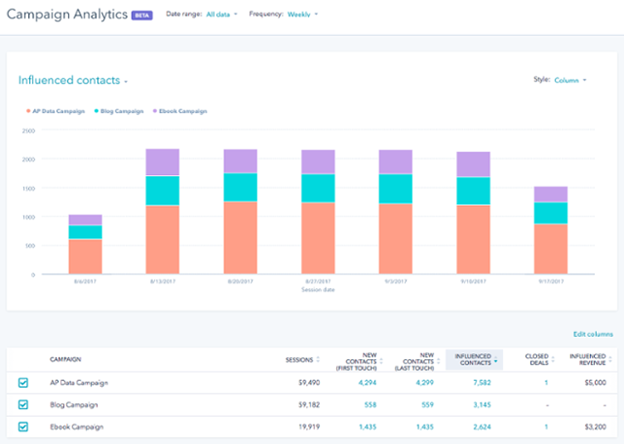
Go to Marketing → Campaigns and open any campaign.
The Performance tab gives you a consolidated view of traffic, conversions, and influenced contacts. On the other hand, the Attribution tab shows how new contacts were created and which assets or sources played the biggest role.
It’s important to know that every asset in the campaign needs to be associated with it. Unlinked landing pages and forms won’t show their conversions here.
4. The Contact Timeline
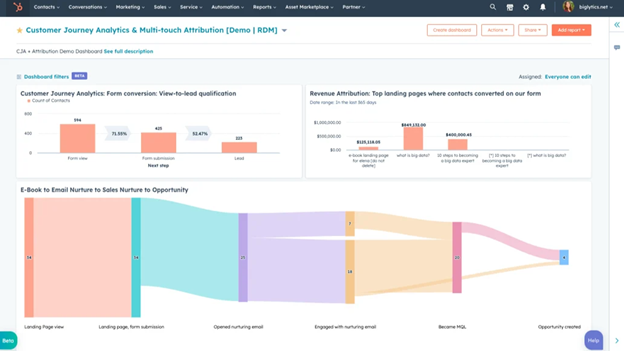
Open any contact record and click the Activity tab.
Form submission events are logged here with the correct form name and timestamp, alongside meetings booked, lifecycle stage changes, and deal associations. Two contact properties sit just above this view that are worth knowing:
- First conversion records the first form submitted
- Last touch converting campaign records the most recent campaign the visitor interacted with before being created as a contact
Use this view when a report is showing unexpected numbers, or when you need to trace exactly what happened at the individual level.
5. Deal Pipelines
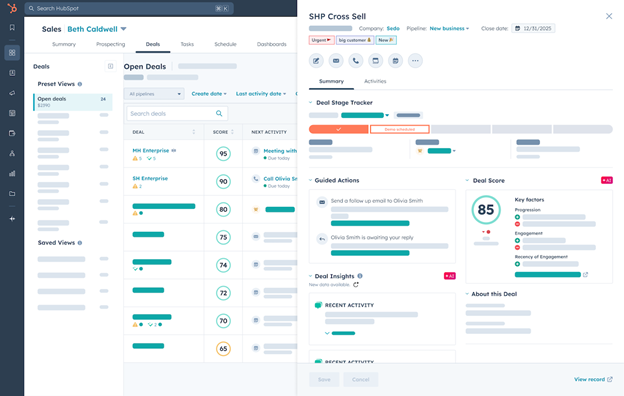
If you’re in sales, conversion data lives in the pipeline.
Each deal stage shows how many deals are sitting there. Drop-off patterns become obvious fast.
A deal report filtered by “created date” and one filtered by “close date” can produce different numbers for the same quarter.
Before presenting pipeline data to leadership, confirm which date field your report is filtering on.


Best Sales Hub Reports in HubSpot
How to Build a Conversion Report in HubSpot Reporting From Scratch
The pre-built reports in the library are a useful starting point, but they rarely answer the specific question your team is actually debating in meetings.
Building your own gives you full control over the data, the filters, and the view.
Two report types will cover most of your conversion reporting needs:
- Funnel report for when your question is about stage-by-stage drop-off: how many contacts moved from Lead to MQL, or how many deals progressed from Proposal to Closed Won
- Custom report builder for when you need to combine data across objects; for example, tying form submissions to lifecycle stage changes and deal outcomes in a single view
Note: Custom reports and funnel reports are available on Professional and Enterprise subscriptions only. You’ll also need Create/own and Edit report permissions in your portal.
Building a Funnel Report in HubSpot Reporting
How to access this:
1. Navigate to Reporting → Reports
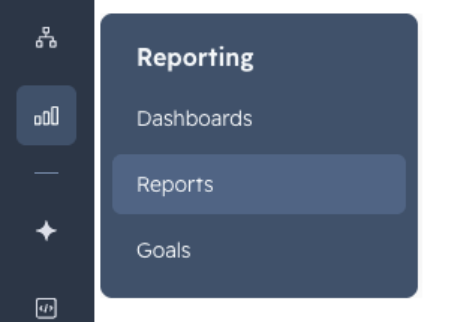
2. Click Create report in the upper right
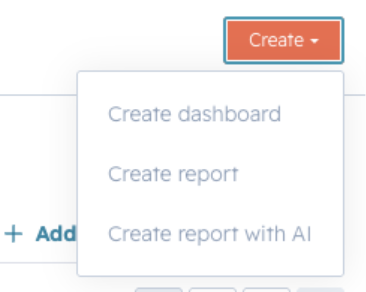
3. Select Funnels from the left panel
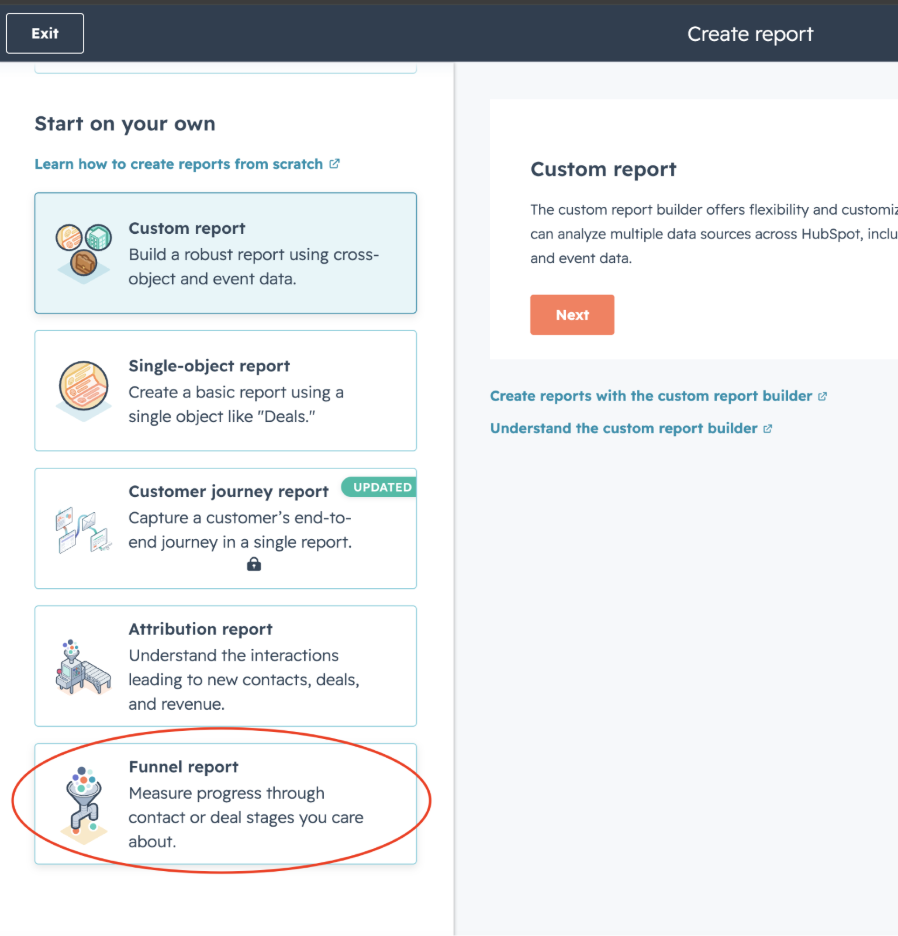
4. Choose Contacts or Deals, then click Next
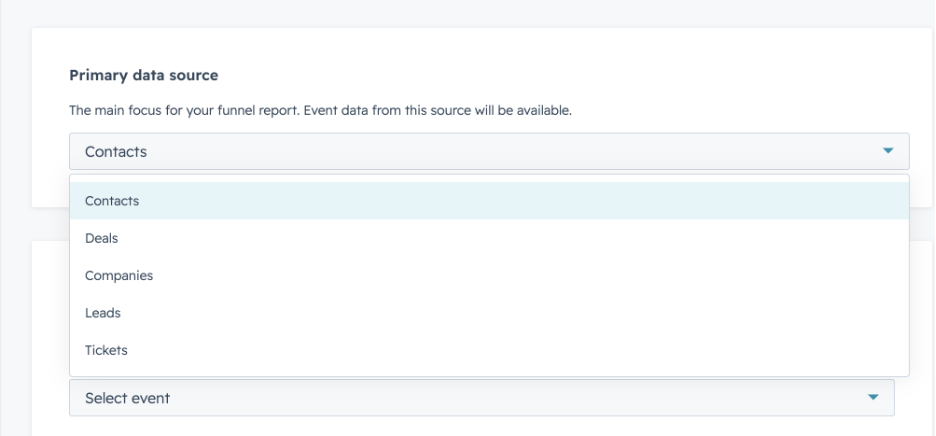
From there, three things determine whether your report is useful or misleading:
1. Your Stages
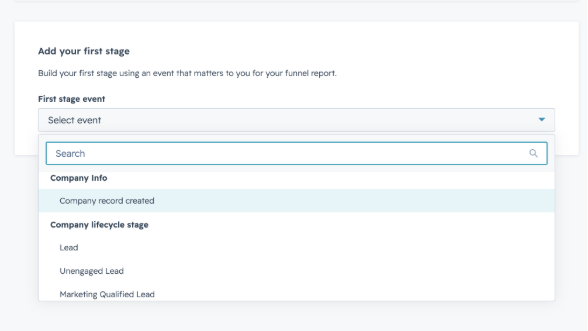
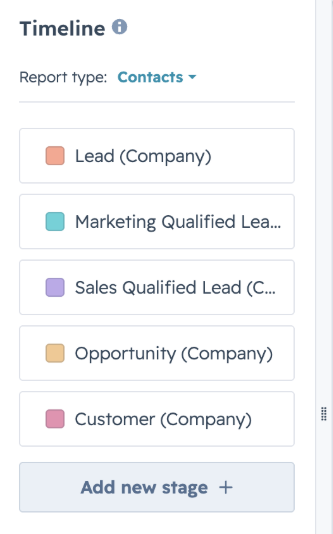
Under Configure funnel, click Add stage and select the lifecycle or deal stages you want to track. A typical marketing funnel runs: Lead → MQL → SQL → Opportunity → Customer. Add only the stages that have a clear, agreed definition in your team.
2. Your Date Range
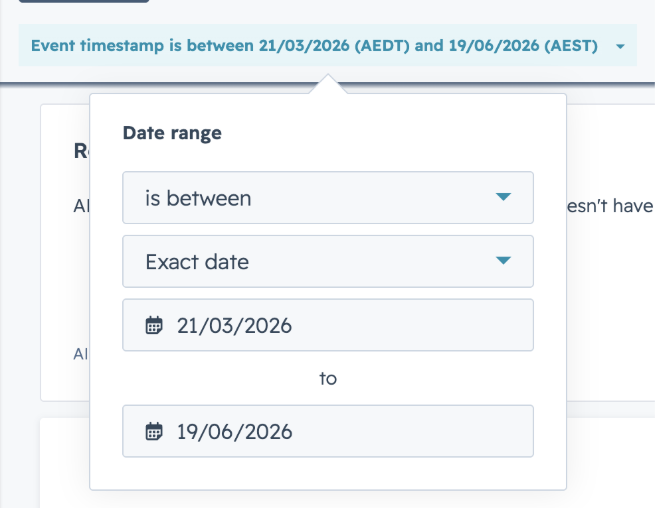
The date range applies to when contacts entered the first stage. Starting with the last 90 days gives enough volume to be meaningful; if your sales cycle is long, extend to 6 or 12 months
3. Your Timestamps
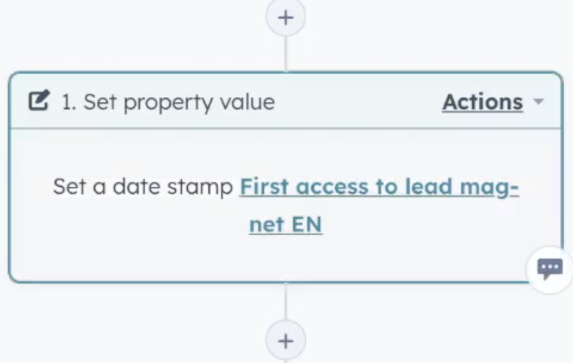
The CRM only counts a contact or deal in a stage if it has a timestamp for that stage. If your lifecycle stages aren’t being stamped through workflows or automation, your funnel data will be inaccurate regardless of how well the report is built
Once your stages, date range, and filters are set, save the report with a specific name like “Contact lifecycle funnel – Q1 2026” and pin it to your main dashboard.
Building a Custom Conversion Report in HubSpot Reporting
Creating a report in the custom report builder follows five steps:
1. Navigate
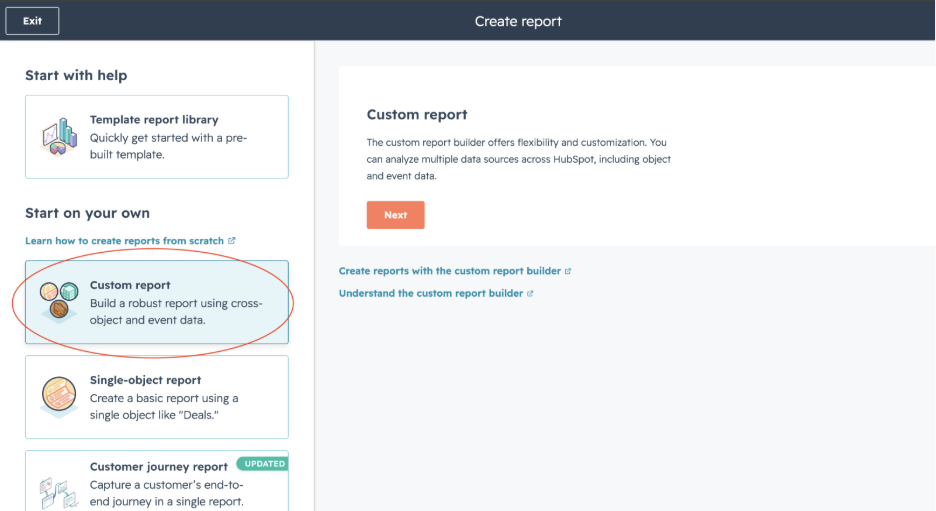
Go to Reporting → Reports → Create report, then select Custom report from the left sidebar.
2. Select Your Data Sources
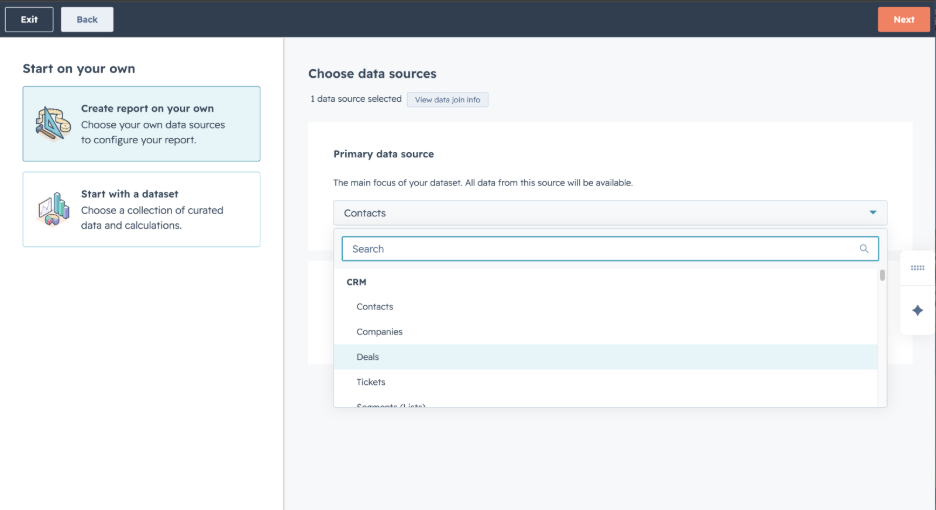
Choose from Contacts, Deals, Companies, Tickets, or custom objects depending on your reporting goal.
For a cross-funnel conversion view, use Contacts as your primary source and Deals as secondary. For form-level conversion data, use Form submissions as your primary data source and Forms as secondary.
3. Add Your Fields
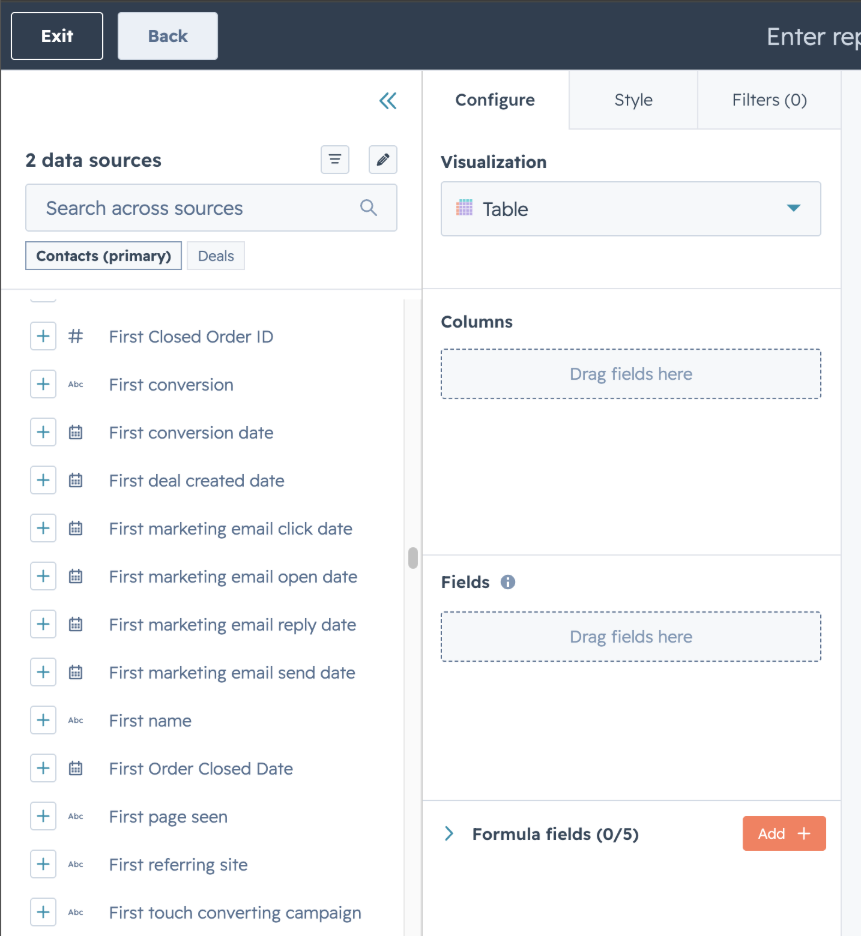
Select the properties that answer your question. For conversion reporting, the highest-value fields are: First Conversion, First Conversion Date, Lifecycle Stage, Original Source, and Deal Stage and Deal Amount.
4. Apply Filters
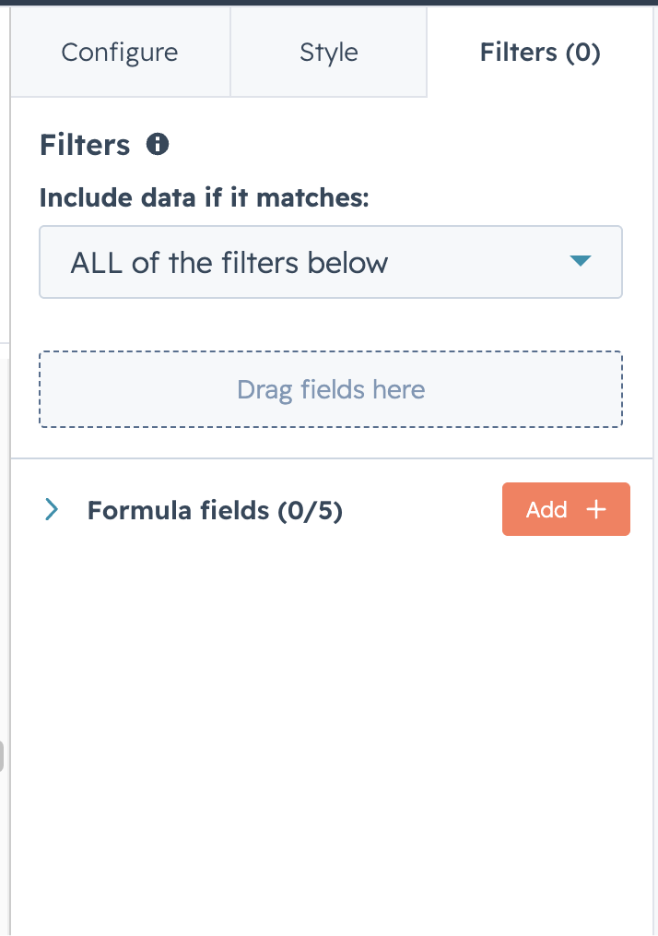
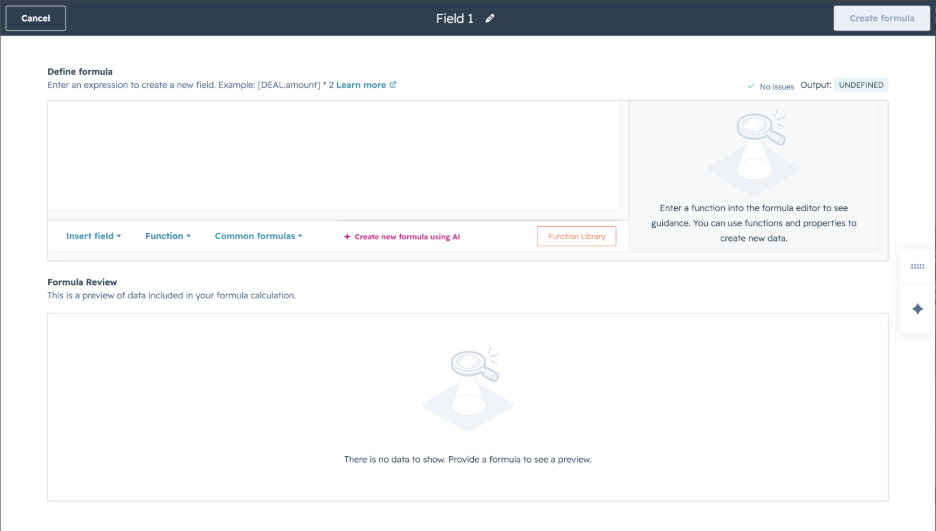
Narrow your dataset to the time period and segment you care about. The power here: you can tie deals to the First Conversion property in the report builder, allowing you to see which types of leads led to revenue opportunities or closed deals. That’s the connection between top-of-funnel conversion activity and actual revenue, and it’s not available in any pre-built report.
5. Set Your Visualisation and Save
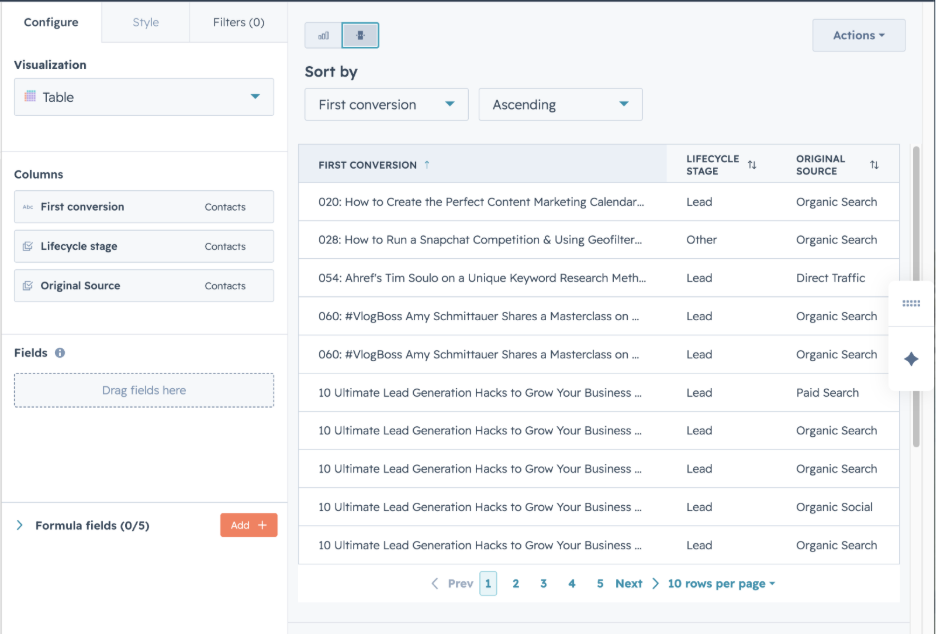
If you’re unsure which chart type fits, enable Smart chart; HubSpot will automatically suggest one based on the fields you’ve added. Save with a name that reflects the question it answers, and add it to the relevant dashboard.
If you’re wondering which report type you should build first, use this table as a guide:
| Your question | Report type to build |
| Where are contacts dropping off between lifecycle stages? | Funnel report: Contacts |
| Where are deals stalling in the pipeline? | Funnel report: Deals |
| Which forms are driving the most conversions? | Custom report: Form submissions + Forms |
| Which traffic sources produce contacts that become customers? | Custom report: Contacts + Deals + Original Source |
| Which marketing assets influenced closed-won deals? | Attribution report (Marketing Hub Pro / Enterprise) |
If you want to learn more about improving the quality of your HubSpot conversion reports, here’s a guide on how you can avoid one common mistake that ruins data quality.
Frequently Asked Questions About HubSpot Reporting
What is HubSpot reporting and what can it track?
HubSpot reporting is the suite of analytics tools built into the CRM platform that lets marketing, sales, and RevOps teams measure performance across the entire customer funnel. It tracks form submissions, lifecycle stage progressions, deal stage conversions, campaign performance, contact attribution, and revenue outcomes, all from a single platform.
What counts as a conversion in HubSpot reporting?
In HubSpot reporting, a conversion can refer to several different events depending on which team is measuring. The four main types are: a form submission (a visitor completes a form and becomes a contact), a lifecycle stage change (a contact advances from Lead to MQL, MQL to SQL, and so on), a meeting booked (a prospect uses a scheduling link to book time with a rep), and a deal created or deal stage progression (a deal moves forward through the pipeline).
Where does conversion data live in HubSpot reporting?
Conversion data in HubSpot reporting is spread across several areas of the platform. Form submission data lives in the Report Library and the custom report builder. Lifecycle stage conversion rates appear in funnel reports under Reporting → Reports. Campaign-level conversion data lives inside individual campaigns under Marketing → Campaigns. Individual contact conversion history appears on the contact record under the Activity tab. Deal pipeline conversion data sits in the Sales Analytics suite. Each location answers a different question, so knowing which to use depends on what you’re trying to measure.
What HubSpot subscription do you need for conversion reporting?
Basic conversion data (including pre-built reports and default dashboards) is available on all plans. Free and Starter plans are limited to single-object reports and up to 10 dashboards. You need HubSpot Professional or above to access the custom report builder, custom funnel reports, and cross-object reports. With an Enterprise subscription, you can also create funnel reports based on custom events.
How do I build a conversion funnel report in HubSpot reporting?
To build a conversion funnel report in HubSpot reporting, navigate to Reporting → Reports, click Create report, and select Funnels from the left panel. Choose either Contacts or Deals, then click Next. Add your funnel stages using the Add stage dropdown; for a lifecycle funnel, this would typically run Lead → MQL → SQL → Opportunity → Customer. Set a date range filter, choose a chart type (funnel bar is recommended for presentations), and save the report to your dashboard.
Why do my HubSpot conversion reports show different numbers across teams?
The most common reasons for conflicting numbers in HubSpot reporting are: using different date filters, inconsistently configured lifecycle stages that mean marketing and sales are measuring different events, duplicate contacts that inflate or distort conversion counts, and mismatched attribution windows that don’t reflect the actual sales cycle length.
What is the difference between a HubSpot report and a dashboard?
A report is a single data visualisation: a chart, table, or KPI card that answers a specific question. A dashboard is a collection of reports arranged on one screen. Dashboards don’t generate data; they organise reports into a view designed for a specific audience. In HubSpot reporting, you build individual reports first, then add them to role-specific dashboards so each team sees only the metrics relevant to their decisions.
How does HubSpot attribution reporting work?
HubSpot attribution reporting tracks which marketing touchpoints (page views, form submissions, ad clicks, or email interactions) contributed to a conversion event such as a new contact being created, a deal being generated, or revenue being closed. You choose an attribution model (first touch, last touch, linear, or multi-touch) that determines how credit is distributed across touchpoints. Contact attribution reports measure which sources, assets, and interactions impacted lead generation and are available on Marketing Hub and Content Hub Enterprise. Revenue attribution reports, which measure which touchpoints had the greatest impact on revenue, are also available on Marketing Hub Enterprise. For teams on Professional, campaign analytics and cross-object custom reports provide a strong approximation of attribution without requiring Enterprise.
Your HubSpot Reporting Should Be Driving Decisions
Most businesses sitting on a CRM full of data are still flying blind even though they have reports and dashboards.
What they’re missing is a clear connection between what the numbers say and what to do next.
Teams that can confidently and clearly connect a form submission to a closed deal in a single conversation will produce ROI from HubSpot.
But teams that can’t will keep fielding the same uncomfortable question: “What’s actually converting?”
The good news, though, is that you now have a clear framework for answering it.
Get in touch with RedPandas’ growth experts for a free consultation, and we’ll show you exactly where your conversion data is strong, where it’s leaking, and what to fix first.

Get In Touch With Our Growth Experts



Get the best content marketing insights right in your inbox!
Subscribe to our Newsletter and get marketing insights delivered to your inbox every week.